Professional project management, planning, control and reporting services designed for complex projects.

We provide end-to-end project management support focused on planning, scheduling, monitoring, control and reporting. Our services help organizations maintain control over time, cost and performance throughout the project lifecycle.
Development of detailed project schedules, baseline planning, schedule updates and milestone tracking using Primavera P6 and MS Project.
Budget development, cost monitoring and earned value management (EVM) to identify variances and support corrective decision making.
Progress measurement, productivity analysis and performance evaluation to ensure alignment with project objectives.
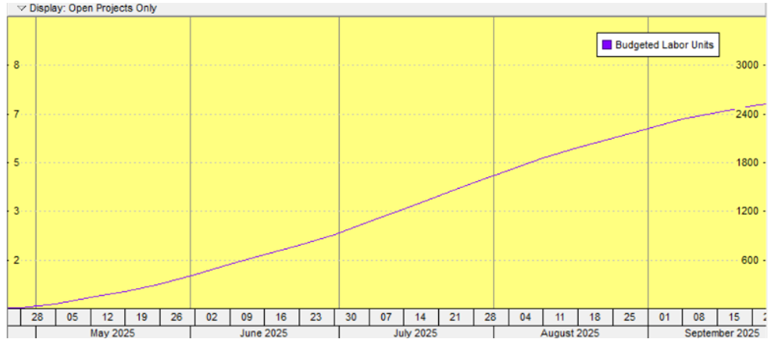
Executive dashboards, S-curves and performance reports using Excel and Power BI.
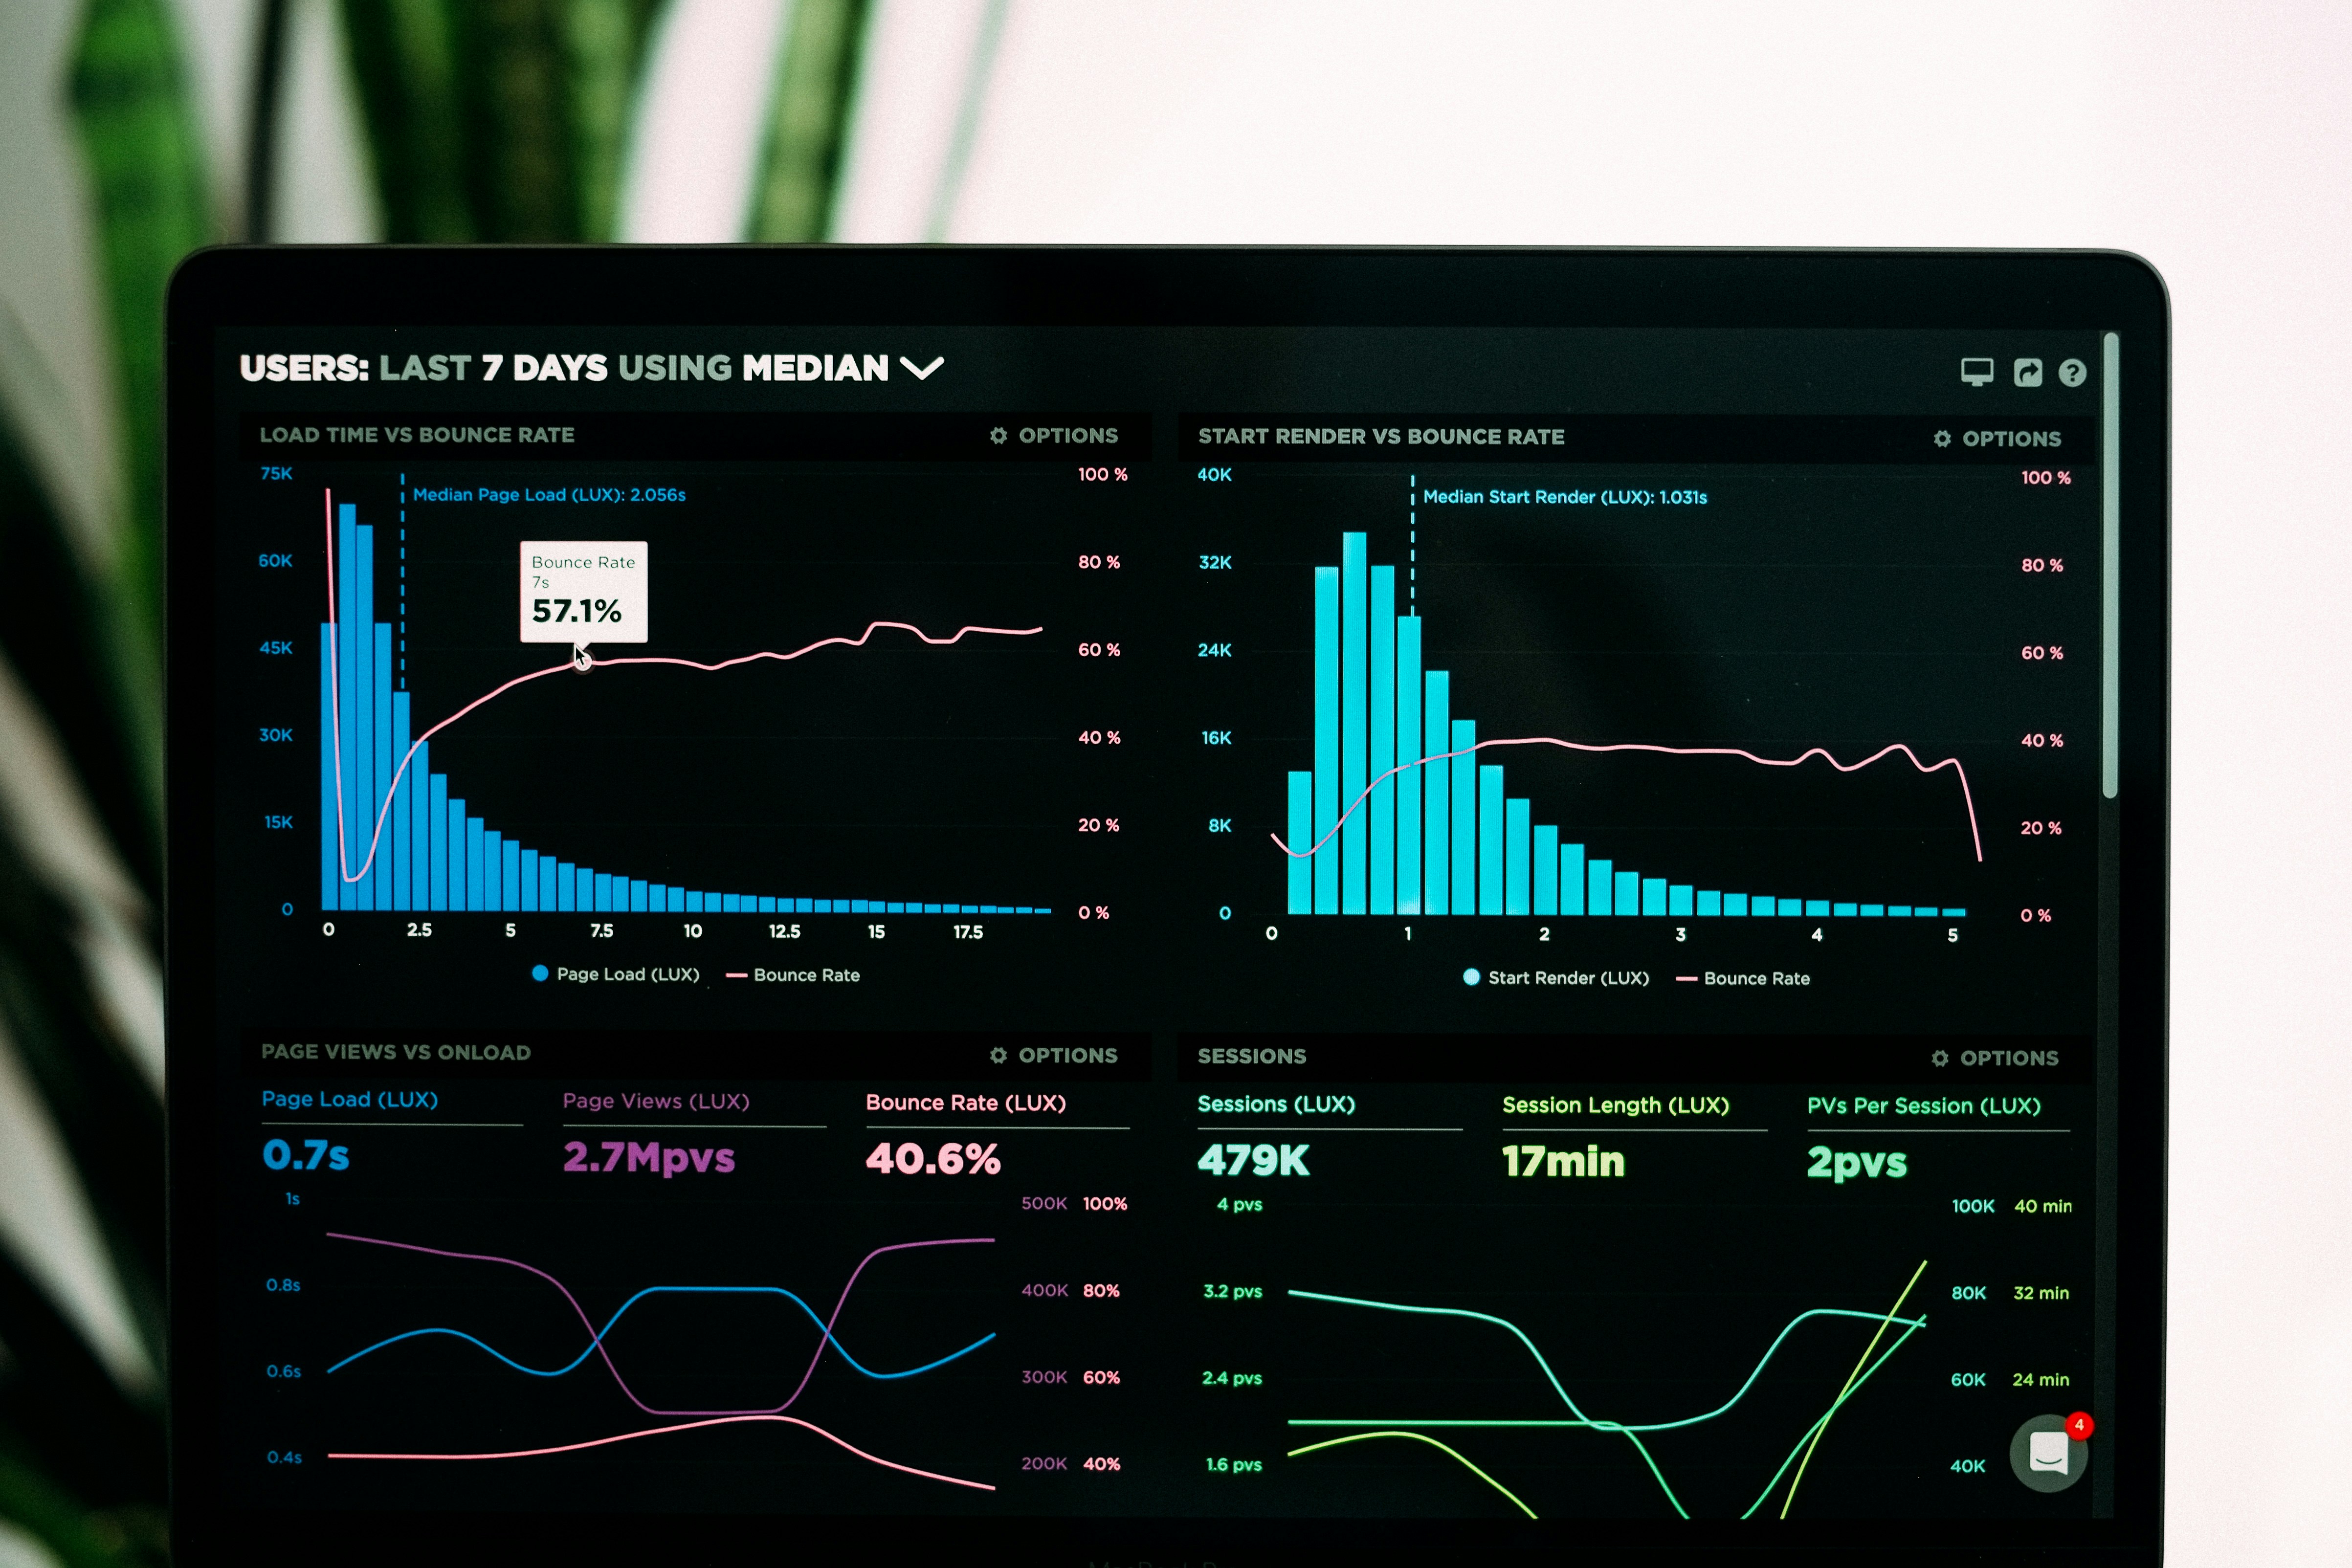
Our reporting and dashboard solutions transform raw project data into clear insights, enabling management to track performance, identify risks and make timely decisions.
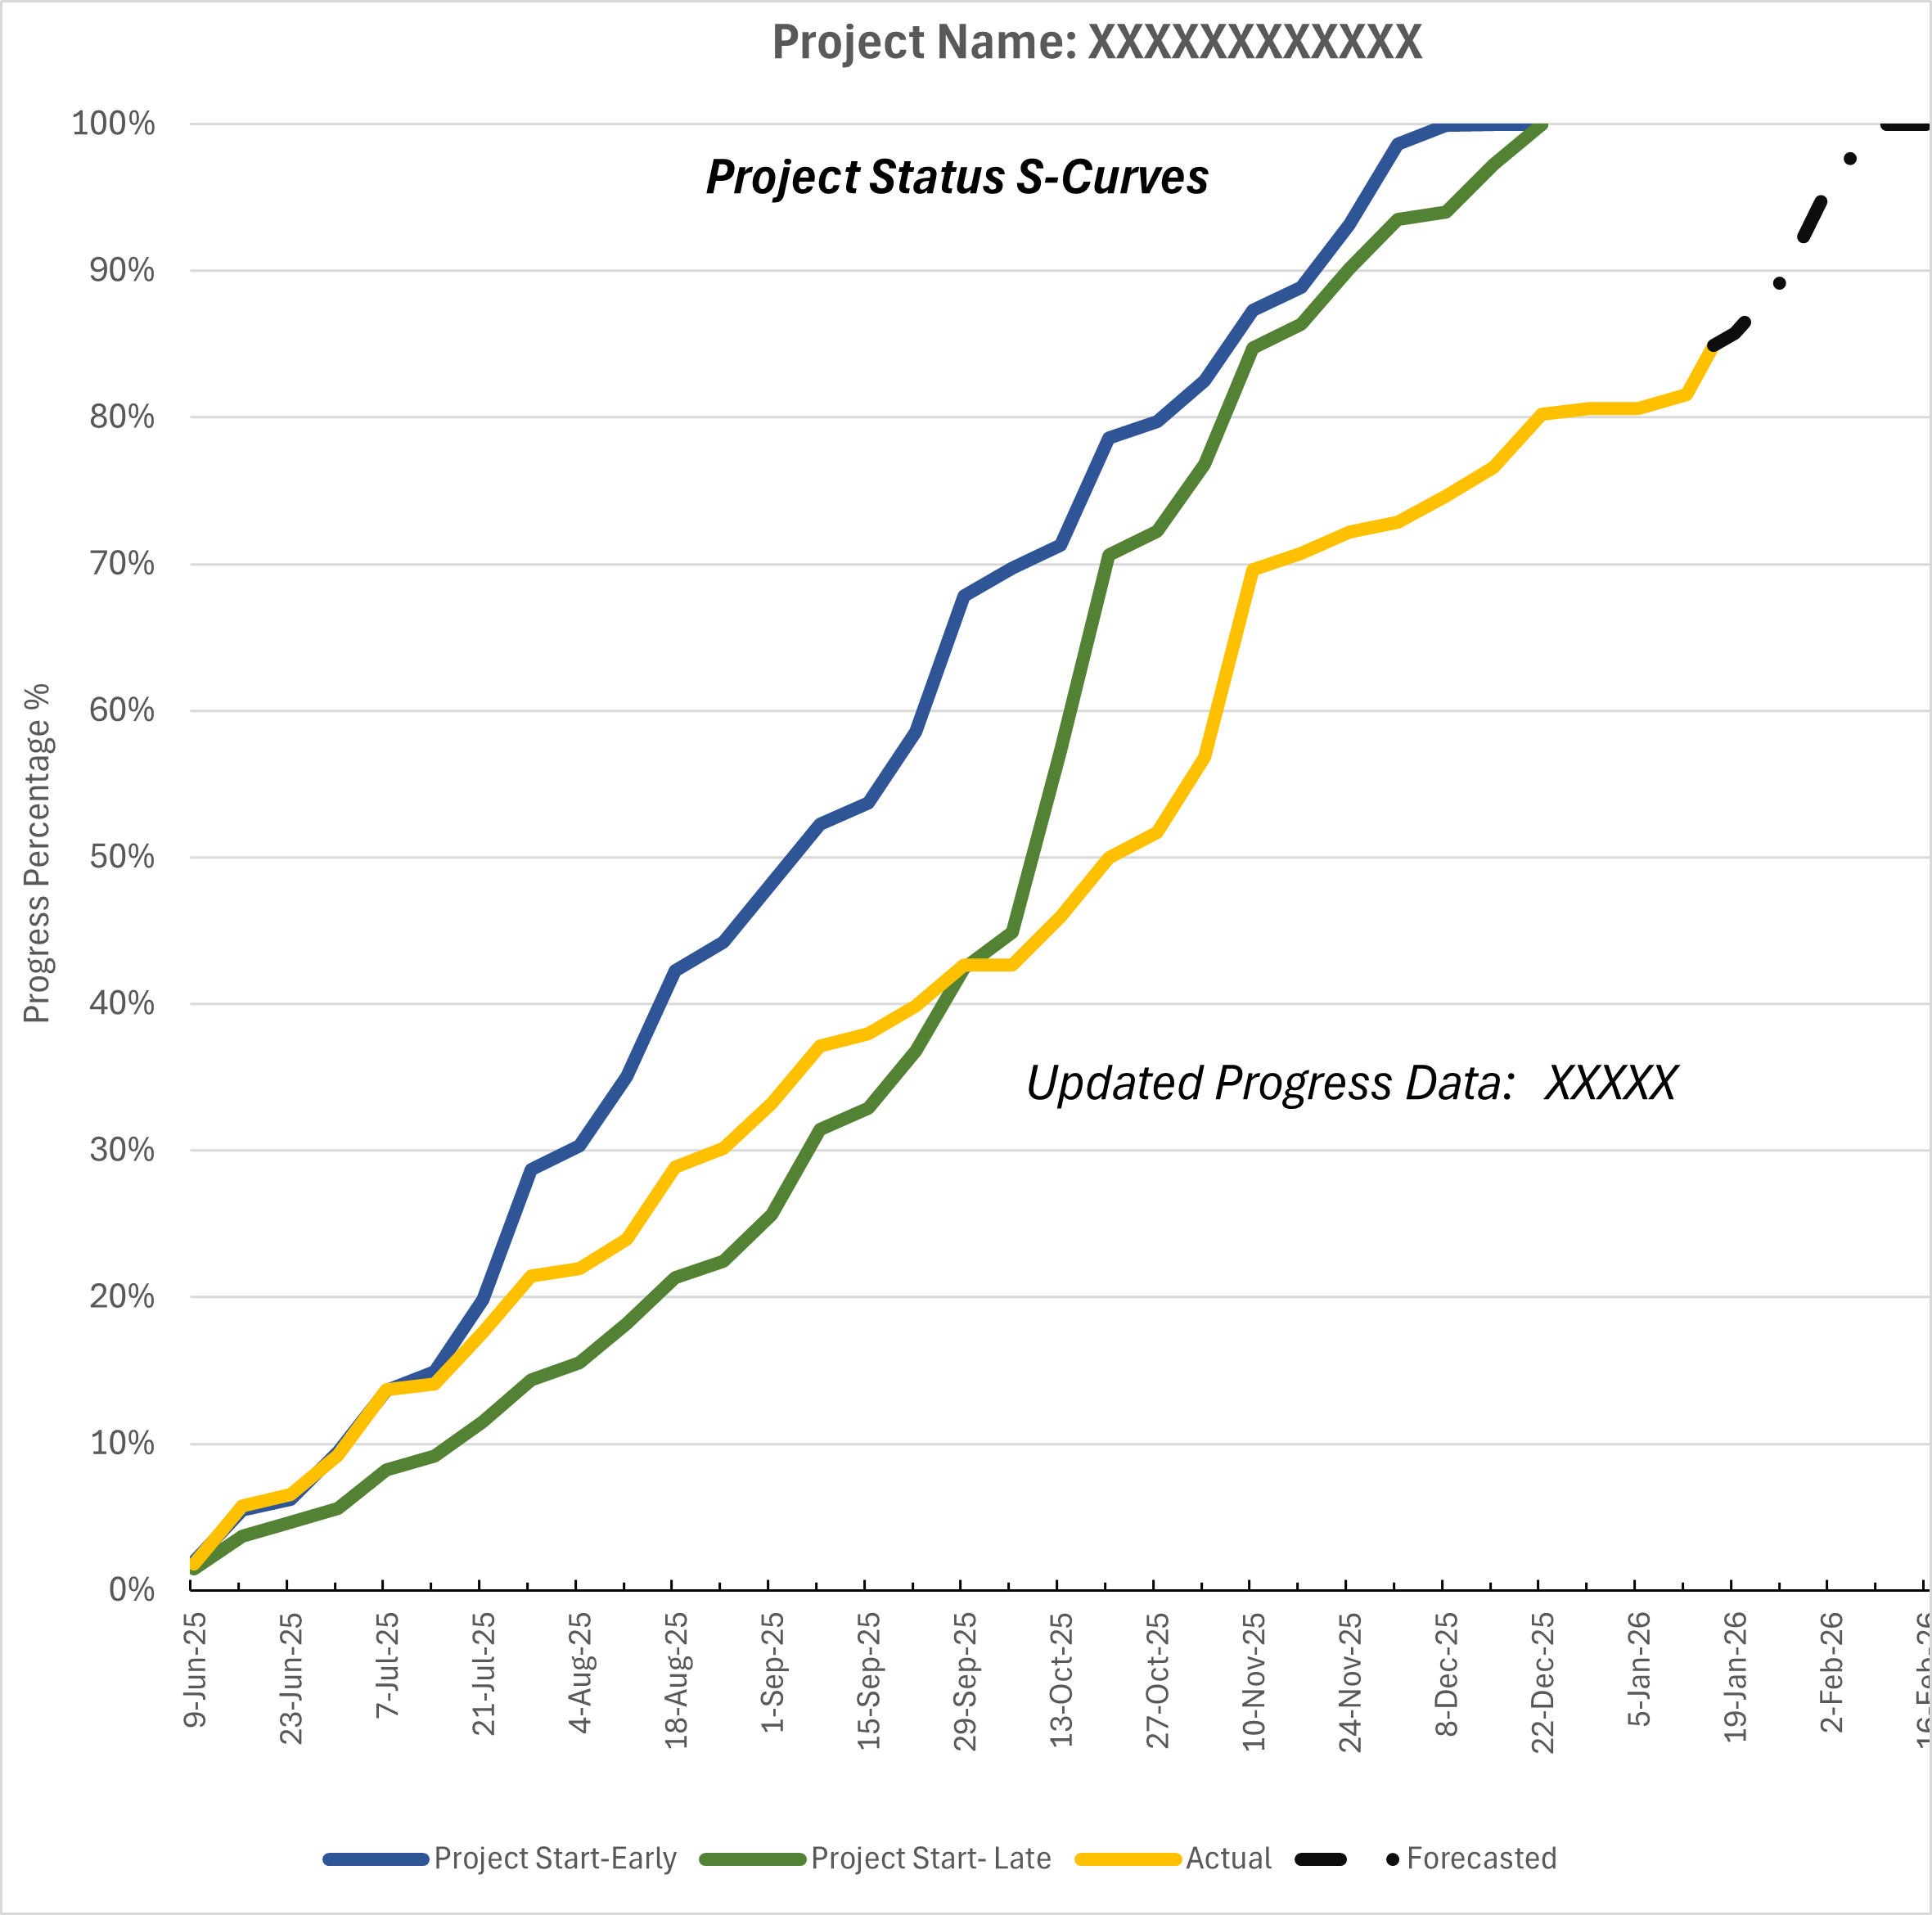
An S-Curve is a chart that shows how a project grows over time. It usually starts slowly, then speeds up in the middle, and slows down again near the end, forming an “S” shape. On the chart, the bottom line shows time, and the side line shows how much work, cost, or progress has been done. It often shows the planned progress and the actual progress of a project, so you can compare them. Using an S-Curve helps managers see if a project is on track, find problems early, plan resources better, control costs, and predict when the project will finish. It’s a simple but powerful way to understand how work is moving and make smart decisions.
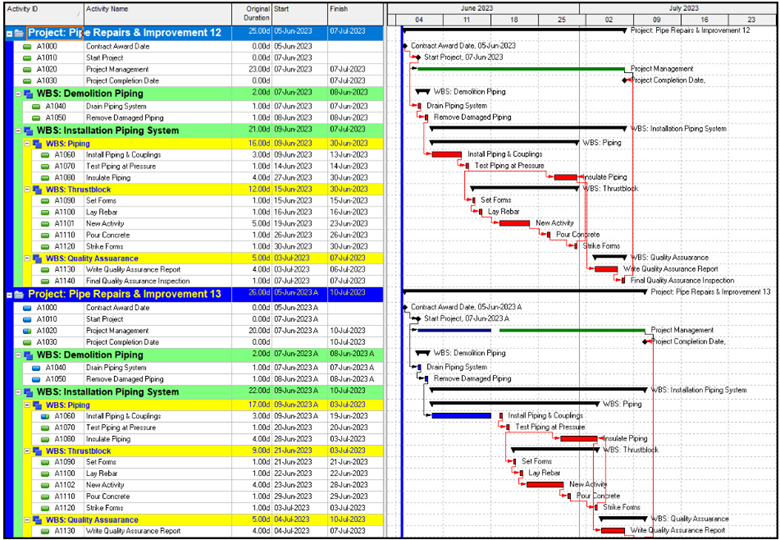
A Gantt Chart is a type of timeline used to plan and manage a project. It shows all the tasks in a project, how long each task will take, and the order in which tasks should be done. You can also see the whole project timeline and the expected finish date. As work progresses, the chart can be updated to show actual progress, new start and finish dates for tasks that are not finished, and also keep a record of the original plan. Using a Gantt Chart has many benefits. It can help you explain the project to clients, showing them each stage and the key milestones, so they understand how the work will move forward. It can also make a tender or proposal stronger, showing that you can plan and manage the project well. The chart can be shared with your team and contractors to tell them when their work is needed. Overall, a Gantt Chart helps a project run more smoothly, saving time and cost by keeping everyone informed and organized.
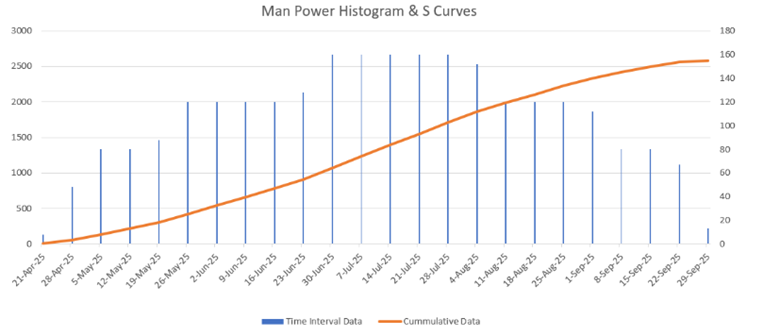
A Manpower Histogram shows the number of workers required over time. This helps in resource allocation, avoiding over- or under-staffing, and controlling labor costs efficiently.
Let us help you plan, control and deliver your project successfully.
Contact Us